Rolling Forecast for Your Business: A Practical Guide to Continuous Cash Flow Planning


A rolling forecast is a financial planning method that continuously updates cash flow projections by shifting the planning horizon forward, week by week or month by month. Unlike a static annual budget that gets locked in at the start of the financial year and is outdated within months, a rolling forecast always gives you a current, forward-looking view of the next 13 weeks or 12 months, regardless of where you are in the financial year.
The fundamental problem with traditional forecasting is what treasury professionals call the horizon wall. A static annual budget covers a fixed period ending at the financial year-end. As months pass, the visibility window shrinks. By Q3, your budget only sees three months ahead. By October, you are essentially blind beyond the year-end cliff with no structured view of what comes next. That is the wall: a hard limit beyond which your finance team has no forward visibility, regardless of how well the original model was built.
In this guide, Agicap explains what a rolling forecast is, how it compares to a traditional budget, how to implement it step by step, and what tools will help you run the process efficiently — whether you are managing a single entity or a multi-entity corporate group.
What Is a Rolling Forecast? Definition and Core Mechanics
A rolling forecast is a financial projection updated on a regular cadence (typically weekly or monthly) by adding a new period to the end of the forecast horizon as the most recent period closes with actual data. The result is a forecast that always covers the same number of forward-looking weeks or months, no matter when you consult it.
The mechanics are straightforward: if you are working with a 13-week horizon and Week 1 closes with real bank data, you add Week 14 to the forecast. The window rolls forward, maintaining the same depth of visibility. That is where the name comes from: the planning window advances continuously, like a moving frame.
Unlike an annual budget that relies on assumptions about a full financial year, a rolling forecast builds on concrete data: issued sales invoices with known payment due dates, committed payables, payroll, scheduled debt service, corporation tax payments, and VAT obligations. Accuracy is high in the near term and becomes increasingly estimate-based as you move further into the horizon.
Rolling Forecast vs Traditional Budget: Key Differences
The difference between a rolling forecast and a traditional budget goes beyond update frequency. It reflects a fundamentally different approach to financial management — and a direct answer to the visibility wall described above.
Criteria | Traditional Budget / Forecast | Rolling Forecast |
Update frequency | Once a year (or quarterly) | Continuous: weekly or monthly |
Time horizon | Fixed: shrinks towards fiscal year-end | Fixed in depth: always 13 weeks or 12 months ahead |
Data basis | Assumptions made at period start | Actual data + updated assumptions |
Reaction to change | Ad hoc revision | Built into the regular process |
Operational utility | Annual strategic planning / FP&A | Real-time treasury decisions |
Operational burden | High at start of year, low after | Distributed consistently throughout the year |
The 13-Week Horizon: Treasury vs FP&A Planning
In UK finance teams, there is an important distinction between FP&A and treasury planning.
FP&A owns the long-range plan and the annual budget, typically a 12-to-18-month view built on strategic assumptions aligned with the board and shareholders. Treasury's function is different: it manages the actual cash position in the near term and ensures the business never runs out of liquidity.
The 13-week rolling forecast sits squarely in the treasury's domain. Three months is the window in which most payment commitments are already identified and expected debtor receipts are reasonably predictable. Beyond 13 weeks, uncertainty grows and operational precision declines. Within that window, the forecast is grounded in concrete data (real invoices, committed payables, scheduled payroll) not strategic assumptions.
Horizon | Data Type | Accuracy | Primary Use |
1–4 weeks | Invoices, committed payments | Very high | Daily cash operations |
5–13 weeks | Forecasts with confirmed data | High | Anticipating liquidity gaps |
13–26 weeks | Estimates with assumptions | Medium | Financing planning |
12 months | Strategic assumptions | Low–medium | Strategic budget / FP&A |
A traditional annual budget still has its place: setting annual targets, communicating with the board and investors, planning long-term capital commitments. But as an operational treasury management solution, it falls short the moment reality diverges from plan, which happens regularly at mid-market companies. A rolling forecast does not replace the annual budget; it layers continuous forward visibility on top of it.
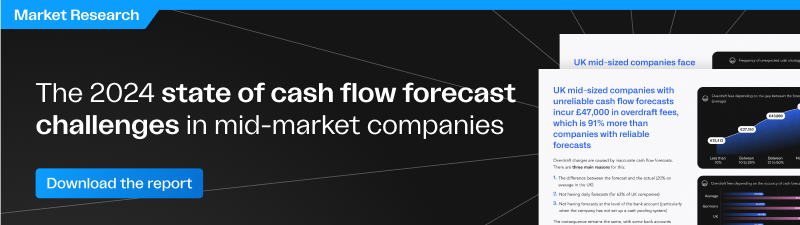
According to Agicap research on treasury challenges at mid-market companies, SMEs face an average of 15 unexpected cash shortfalls exceeding £40,000 per year — and 24% of companies encounter at least one per month. A continuous forecasting approach like a rolling forecast converts many of those surprises into situations identified three to four weeks in advance.
Why a Rolling Forecast Is Especially Valuable for Treasury Operations
Rolling forecasts can be applied to sales, P&L, or virtually any financial metric. But it is in treasury and cash management where the method delivers the most immediate, measurable value. The reason is straightforward: treasury operates on concrete short-term data. An issued sales invoice has a known payment due date. A supplier payment is committed. Payroll is exact.
That concreteness makes a rolling cash flow forecast significantly more accurate than a rolling sales or margin forecast, where estimates carry a wider range of uncertainty. And that accuracy is what gives your CFO and treasury team the confidence to take real action: activate a revolving credit facility, delay a discretionary payment, or accelerate collection on a past-due debtor balance.
Three Operational Problems a Rolling Forecast Solves
1. The forecast wall: no visibility beyond the horizon
With a static annual budget, your forward visibility shrinks every month. By September, you are looking at a three-month window. By November, you cannot see past the financial year-end, which is precisely when you need to be planning for the new financial year. A rolling forecast eliminates this wall: there is always a full 13-week (or 12-month) view ahead, regardless of when you look.
2. Late reaction to liquidity gaps
With a continuous forecast, a projected cash deficit surfaces weeks in advance, when your options are broader and less costly. You have time to negotiate extended payment terms with creditors, draw on a revolving credit facility at a lower rate, or accelerate debtor collections before you are in a reactive scramble.
3. Disconnect between plan and operational reality
A rolling forecast systematically incorporates actual data, eliminating the gap that accumulates in static models. By the time a quarterly budget review happens, a rolling forecast has already been refreshed a dozen times.
How to Implement a Rolling Forecast: A Step-by-Step Process
Implementing a rolling forecast for your business does not require an immediate technology transformation. You can start with the tools you have and build sophistication over time. What it does require is a clear process, a defined cadence, and a designated owner who keeps it current.
For teams already using Agicap, there is an additional layer available: Agicap's MCP integration allows you to query your live cash position, scenarios, and invoice data directly from an AI assistant like Claude without switching tools.
A treasurer can ask for a projected cash gap, compare scenarios, or pull debtor-level data conversationally, with Agicap as the live data layer behind it. The integration is currently available to Agicap customers. Speak to your account team about access.
Step 1: Define Your Horizon and Update Cadence
Start by deciding how many weeks or months your rolling forecast covers and how often it is updated.
- •
For operational treasury management (managing cash day to day, anticipating liquidity gaps): 13 weeks, updated weekly.
- •
For a strategic treasury view (financing decisions, debt management, board reporting): 6 or 12 months, updated monthly.
- •
For FP&A alignment: a 12-month rolling forecast can bridge treasury and long-range planning — but it should be maintained separately from the 13-week operational model.
The update cadence matters as much as the horizon. A forecast updated monthly loses visibility precisely when uncertainty is highest. Weekly updates are the minimum standard for the 13-week model to function as a real decision-making tool.
Step 2: Establish Your Opening Balance and Data Sources
Your rolling forecast starts from the actual consolidated cash balance across all of your bank accounts at the moment the forecast begins. If your business operates with multiple banking relationships or multiple entities, that balance must be a single consolidated starting figure.
Three categories of data feed the rolling forecast:
Cash inflows
- •
Customer receipts with actual or estimated due dates (based on historical debtor days)
- •
Advance payments and deposits
- •
VAT repayments from HMRC
- •
Interest and investment income
Committed cash outflows
- •
Supplier payments and purchase ledger obligations
- •
Payroll and PAYE/National Insurance contributions
- •
Rent, rates, and property costs
- •
Debt service (principal and interest payments)
- •
VAT payments to HMRC, corporation tax instalments, and other HMRC obligations
- •
Any other known upcoming disbursements
Historical patterns
Actual payment and collection behaviour from prior months, used to calibrate estimates for the more distant periods in the horizon. This is especially important for modelling debtor payment behaviour; a key driver of cash timing under UK GAAP (FRS 102) and IFRS as adopted in the UK, where accrual accounting separates invoice date from cash receipt.
Step 3: Classify Cash Flows by Certainty Level
Not all cash flows carry the same confidence. For your rolling forecast to be operationally useful, distinguish between:
- •
Certain flows: payroll, rent, scheduled debt payments, known HMRC obligations
- •
Probable flows: collections on issued invoices within normal payment terms
- •
Estimated flows: collections on invoices with historical payment delays, income from projects in progress
This classification lets you build the forecast with differentiated confidence levels and forms the foundation for scenario planning, covered in the next step.
Step 4: Build Realistic, Optimistic, and Pessimistic Scenarios
A single forecast line does not capture the real uncertainty in your business. Running three parallel scenarios prepares your finance team with planned responses before a problem arrives.
Variable | Base Scenario | Pessimistic Scenario | Optimistic Scenario |
Customer debtor days (DSO) | 45 days | 54 days (+20%) | 38 days (-15%) |
Turnover shortfall | 0% | -10% for one month | +8% for one month |
Unexpected payment (not in original forecast) | None | Yes, £25K–£50K | None |
Revolving credit facility | Not activated | Partially activated | Not needed |
A note on unexpected payments: the pessimistic scenario should specifically account for cash outflows that were not in your original forecast — a supplier demanding early payment, an unplanned equipment repair, or an insurance excess. These are not exceptional items in the accounting sense; they are simply unforeseeable at forecast time. Modelling them explicitly forces the question: what do we do if £25K–£50K disappears from our cash position unplanned? Having a pre-built answer is what separates proactive treasury management from reactive firefighting.
Step 5: Set Liquidity Thresholds and Automated Alerts
A rolling forecast delivers real operational value when it is connected to an alert system. Define a minimum cash threshold below which your finance team receives an automatic notification. A common benchmark for mid-market UK businesses: maintain at least four to eight weeks of fixed operating costs as a minimum cash buffer for businesses with variable turnover. Organisations with predictable cash flows may operate with tighter buffers.
Alerts transform a rolling forecast from a passive planning exercise into an active early-warning system, one of the most underutilised capabilities at mid-market treasury functions.
Step 6: Maintain the Process with Weekly Discipline
The most common failure mode in rolling forecast implementation is maintenance. Many organisations build a solid initial model and then let the cadence slip, losing the tool's value at precisely the moment they need it most.
Updating the rolling forecast each week requires:
- •
Importing actual bank movements for the week that just closed
- •
Adjusting collection assumptions for debtors showing payment delays
- •
Adding any newly committed payables or unplanned outflows
- •
Extending the horizon by adding one new week to the far end
The biggest obstacle to maintaining that cadence at mid-market companies is not lack of intention, it is the operational cost. If updating the rolling forecast requires hours of manual work in Excel, the natural tendency is to do it as infrequently as possible. That is where automation makes the real difference.
Rolling Forecast in Multi-Entity Corporate Groups
For corporate groups operating with multiple subsidiaries, the rolling forecast carries additional complexity: entities hold accounts at different banks, may operate across multiple currencies, and the cash position of one entity may be deployable to resolve a liquidity gap in another through an intercompany loan or notional cash pool.
Without a real-time consolidation view of the group's cash position, that opportunity is invisible. The most common scenario: one subsidiary sits on idle cash while another faces a liquidity shortfall that could be resolved internally but nobody knows because the data lives in separate spreadsheets. Without consolidation, identifying and executing that intercompany transfer takes days.
A multi-entity rolling forecast requires three capabilities beyond the single-entity model:
- •
Real-time consolidation of cash positions across all entities, with visibility at both the subsidiary and group level
- •
Intercompany cash flow management: modelling intercompany loans and cash pooling arrangements as liquidity levers within forecast scenarios
- •
Coordinated update process: clear ownership for each entity's forecast, a defined cadence, and automated aggregation at the group level
Treasury platforms like Agicap are built for this complexity, consolidating cash positions across all entities in real time, updating the rolling forecast automatically as new bank transactions feed in, and managing scenarios from a single environment without maintaining parallel spreadsheet files for each subsidiary.
Rolling Forecast in Excel: Limitations and When to Move On
Excel is where most mid-market UK finance teams build their first rolling forecast. In the early stages, it works. The problem emerges when the organisation grows and the operational cost of maintaining the forecast in spreadsheets begins to outweigh the benefits.
Structural Limitations of Excel for Rolling Forecasts
No real-time bank data
Bank transactions must be imported manually, introducing delays and reconciliation errors that undermine the accuracy the method depends on.
Scenario management is time-consuming
Maintaining three parallel versions of the same model in separate worksheets consumes significant time and creates version-control problems. A change in one assumption needs to be replicated manually across all three scenarios.
No automated alerts
Identifying that projected cash has dropped below your minimum threshold requires manually reviewing the model. There is no system watching the forecast for you.
Collaboration across AP, AR, and treasury is fragile
Sharing and consolidating inputs from the purchase ledger team, sales ledger team, and treasury in a shared Excel file creates version conflicts and ownership ambiguity, particularly when multiple team members update data simultaneously.
Multi-entity consolidation does not scale
Consolidating rolling forecasts across five or ten subsidiaries in Excel requires a manual aggregation process that produces a group view already outdated by the time it reaches the CFO or Group Treasurer.
For mid-market UK businesses managing more than two entities, multiple banking relationships, or weekly forecast updates across a distributed finance team, a specialist cash management platform eliminates the structural bottlenecks that make spreadsheet-based rolling forecasts unsustainable at scale.
Agicap automates bank feed integration, real-time cash consolidation, and scenario management in a single environment — reducing the weekly maintenance burden from hours to minutes.
Frequently Asked Questions (FAQs) about Rolling Forecasts
What is a rolling forecast in business?
A rolling forecast is a financial planning method that updates projections continuously by moving the forecast horizon forward each period. In treasury management, it typically covers 13 weeks and is refreshed every week, always maintaining the same depth of forward visibility. Unlike a static budget that ages from the moment it is published, a rolling forecast remains current throughout the financial year and eliminates the end-of-horizon blind spot that affects traditional annual planning.
What is the difference between a rolling forecast and a traditional budget?
A traditional budget is built once a year, covers a fixed financial year period, and becomes increasingly blind as the year progresses. The horizon shrinks month by month until there is nothing left to see. A rolling forecast always covers the same forward-looking window, is updated with actual data on a regular cadence, and adapts to market changes as part of the routine process rather than through ad hoc revisions. The rolling forecast does not replace the annual budget, it complements it with continuous operational visibility.
What are the main benefits of a rolling forecast for SMEs and mid-market companies?
The core benefits are:

Continuous forward visibility: there is always a full 13-week or 12-month view ahead, regardless of where you are in the financial year.
Earlier identification of liquidity gaps: problems surface weeks in advance, when your options are broader and cheaper.
Better-informed financing decisions: revolving credit facilities and term loans can be planned proactively rather than drawn in a reactive scramble.
Reduced budget cycle burden: instead of a time-intensive annual exercise, the forecasting workload is distributed evenly across the year.
Alignment with operational reality: the forecast reflects actual bank movements and debtor behaviour, not stale assumptions from twelve months ago.
How do you build a rolling forecast in Excel?
To build a 13-week rolling cash flow forecast in Excel:
Create a summary tab with the actual opening cash balance across all bank accounts.
Set up weekly columns for the next 13 weeks.
Enter projected inflows: customer receipts by due date, advance payments, VAT repayments.
Enter committed outflows: supplier payments, payroll and PAYE/NI, rent, debt service, VAT and corporation tax instalments.
Calculate projected weekly ending balances and flag weeks that fall below your minimum cash threshold.
Each week: record actuals for the closing week, add a new week to the far end, and update collection assumptions.
The main limitation: Excel does not connect directly to your bank accounts, has no automated alerts, and scenario management requires maintaining multiple files in parallel. For businesses managing more than two entities or multiple banking relationships, a platform like Agicap automates these steps and significantly reduces the weekly maintenance burden.
How often should a rolling forecast be updated?
At minimum, weekly. During periods of active liquidity pressure (rapid-growth phase, a credit facility negotiation, or an economic shock affecting customer payment behaviour), daily updates are appropriate. A rolling forecast that is not maintained at the right cadence loses its value as a decision-making tool, and can create false confidence about your actual cash position.
What software is used for rolling forecasts?
Mid-market UK finance teams have three main options:
Spreadsheets (Excel or Google Sheets)
Treasury modules embedded in ERP platforms
Purpose-built cash management platforms like Agicap.
Spreadsheets offer flexibility but become operationally costly at scale. ERP treasury modules integrate well with accounting data but often lack the agility needed for weekly operational forecasting. Specialist platforms combine direct bank feed integration, automated forecast updates, scenario management, and liquidity alerts in a single environment. Making the rolling process sustainable without manual overhead.


