12-Month Cash Flow Forecast: Free Excel Template & Strategic Guide for UK Finance Leaders


A 12-month cash flow forecast sits at the intersection of day-to-day treasury management and the annual budgeting cycle. It is the exact horizon that boards, lenders, and investors scrutinize when assessing structural liquidity.
In this guide, Agicap details how to construct a robust annual model, integrates key regulatory and reporting requirements, and provides a free 12-month cash flow forecast template to establish your baseline.
What is a 12-month rolling cash flow forecast?
A 12-month rolling cash flow forecast is a financial projection that consistently models expected cash inflows and outflows exactly 12 months into the future. Unlike static annual budgets that reset at the end of the fiscal year, a rolling forecast maintains a constant 12-month horizon. As each month closes, that period drops off the model and a new month is appended to the far end.


This long-term planning tool operates differently from the shorter, more granular 13-week rolling forecast used by treasury teams to manage weekly liquidity and daily payment execution. The 12-month version is a pillar of Financial Planning & Analysis (FP&A) and board-level reporting, essential for CEOs when evaluating capital expenditure (CapEx), headcount expansion, or international scaling a year out.
The Difference Between a Cash Flow Forecast, Statement, and Report
Understanding the precise financial definitions of these documents is critical when briefing stakeholders or financial institutions:
Cash Flow Forecast
Forward-looking. It predicts future liquidity dynamics based on operational and market estimates.
Cash Flow Statement
Historical. It is a core statutory accounting document (alongside the P&L and balance sheet) prepared under UK GAAP (FRS 102) or IFRS, reflecting movements that have already occurred.
Cash Flow Report
Internal management tool. It typically merges historical actuals with near-term projections to monitor the real-time cash position.
Why 12-Month Cash Flow Projections Matter for Group CFOs and Boards
Relying solely on short-term liquidity visibility introduces structural blind spots. Maintaining an extended 12-month view gives companies distinct strategic advantages:
- •
Covenant and Lender Compliance: Banks and asset-based lenders frequently mandate a forward-looking 12-month view as part of regular credit facility reporting, particularly when revolving credit facilities (RCF) are active.
- •
Audit and Investor Confidence: A verifiable annual cash runway underpins critical corporate actions, such as dividend payouts, major hiring tranches, and lease renewals, and serves as core evidence for going-concern assessments during annual audits.
- •
Proactive Variance Tracking: Comparing your live forecast against the original annual budget highlights operational divergence early, giving finance teams the necessary runway to make informed financial decisions and execute corrective actions.
Strategic Insight
For multi-entity groups, managing this process manually via spreadsheets is a common cause of data latency. By the time every subsidiary’s cash flow statement template or operational spreadsheet is collected, validated, and consolidated, the group-level view presented to the CFO is often already one to two weeks out of date.

How to Build a 12-Month Cash Flow Forecast Excel Model
The mechanical principle of the forecast is straightforward: for each period, you offset expected income against your forecasted expenditure for each month. The net variance (surplus or deficit) updates the closing balance, which seamlessly rolls over as the opening cash balance for the subsequent month.
Mapping Monthly Income and Expenditure
To ensure the model delivers actionable insights, every material cash movement must be accurately categorized:
Inflows & Income Lines | Outflows & Operational Expenditure |
Customer receipts & direct cash sales Cheques cleared Grants, tax refunds & VAT repayments Income from investments & licensing/patents | Salaries, PAYE, and National Insurance contributions Facilities rent (offices, warehouses, factories) Supplier payments & inventory procurement SaaS software fees & general utilities Corporation Tax, VAT, and loan amortization |
Worked Example: A UK Group's Two-Month Cash Baseline
Below is a practical baseline extraction for the first two months of a financial cycle, starting with an initial opening cash balance of £3,000.
Item | January | February |
Opening Cash Balance | £3,000 | £7,400 |
Revenues & Inflows |
|
|
Revenue from sales | £5,000 | £6,000 |
Income from financial investments | £500 | — |
Tax refunds | £1,000 | — |
Licences | £2,000 | £2,000 |
Total Inflows | £8,500 | £8,200 |
Expenses & Outflows |
|
|
Salary payments and wages | £2,000 | £2,000 |
Inventory | £1,000 | £1,200 |
Marketing | £500 | £400 |
General expenses | £500 | £400 |
Software fees | £100 | £100 |
CapEx / Investments | — | £4,000 |
Tax payments | — | £500 |
Total Expenses | £4,100 | £8,700 |
Net Monthly Balance | £4,400 | -£500 |
Closing Cash Balance | £7,400 | £6,900 |
Note
Data structured according to standard financial modeling practices. While recurring items like software fees remain flat, structural outlays such as CapEx or tax payments create the variances that boards need to track.
Download Your Free 12 Month Cash Flow Projection
To eliminate the friction of building this infrastructure from the ground up, you can access our professional 12-month cash flow forecast template UK edition. It features pre-configured calculations designed specifically around standard UK financial layouts.
This cash flow projections template excel provides automated running balance updates as soon as you populate your monthly operational targets. It serves as an ideal baseline for single-entity modeling or organizations initiating structured forecasting for the first time.
The Limits of a Cash Flow Report Template for Multi-Entity Companies
While a manual 12-month cash flow forecast excel model is highly effective for localized operations, its utility diminishes as corporate cash management complexity increases.
No annual projection remains completely accurate for 12 months; its value depends entirely on continuous updates. When customer payment cycles shift, supplier contracts change, or intercompany balances alter, the model must be refreshed.
For group finance directors managing multiple corporate banking relationships and diverse subsidiaries, updating a spreadsheet model monthly, or shifting to a necessary weekly cadence, becomes a significant operational bottleneck. Manual data re-entry inevitably introduces errors, leads to version control issues, and delays strategic visibility.
Beyond Static Spreadsheets: Automated Cash Flow Planning
To see how modern finance teams are eliminating manual spreadsheet maintenance, read our comprehensive guide to cash flow forecasting architecture.
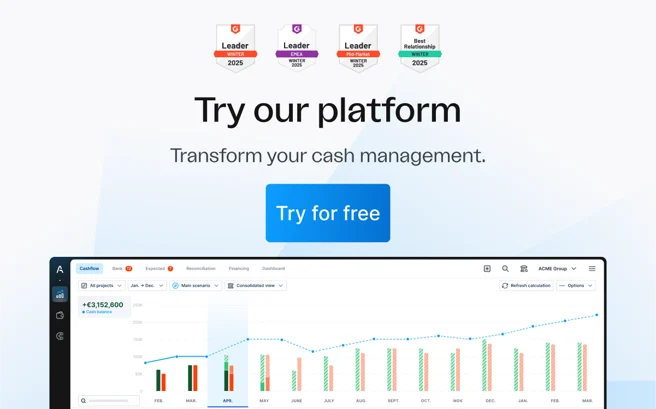
Enterprise software platforms like Agicap resolve these structural bottlenecks by connecting directly to your bank feeds and ERP systems. Group-level consolidation occurs automatically, replacing estimated projections with actual transactional data in real time. This ensures your 12-month rolling outlook remains continuously accurate and board-ready without the administrative burden.
Frequently Asked Questions (FAQs) about 12-month Cash Flow Forecast
What is a 12-month rolling cash flow?

It is a dynamic financial forecasting practice where the projection window always spans the next 12 months. Each month, the historical actuals replace the oldest forecasted period, and a new month is added to the horizon, preventing the model from expiring at year-end.
How do you build a 12-month cash flow forecast excel model?
You start by listing all expected revenue inflows and operational expenditure lines across a 12-month timeline. Subtracting outflows from inflows yields the net monthly balance, which is carried forward as the next period’s opening cash position. Utilizing a pre-structured template prevents architectural errors.
How often should group finance teams update their 12-month projections?
At a minimum, monthly. However, companies managing multiple operating entities, fast-moving supply chains, or volatile market demands typically require rolling weekly updates to ensure the data remains actionable.
Ready to transition from static financial models to real-time treasury intelligence? Start your free trial with no obligation!


